 Numbers, and the interpretation of numbers, play a big role in litigation. Presenting numerical data in court often requires a good graph of the numbers to show changes and trends in the numbers.
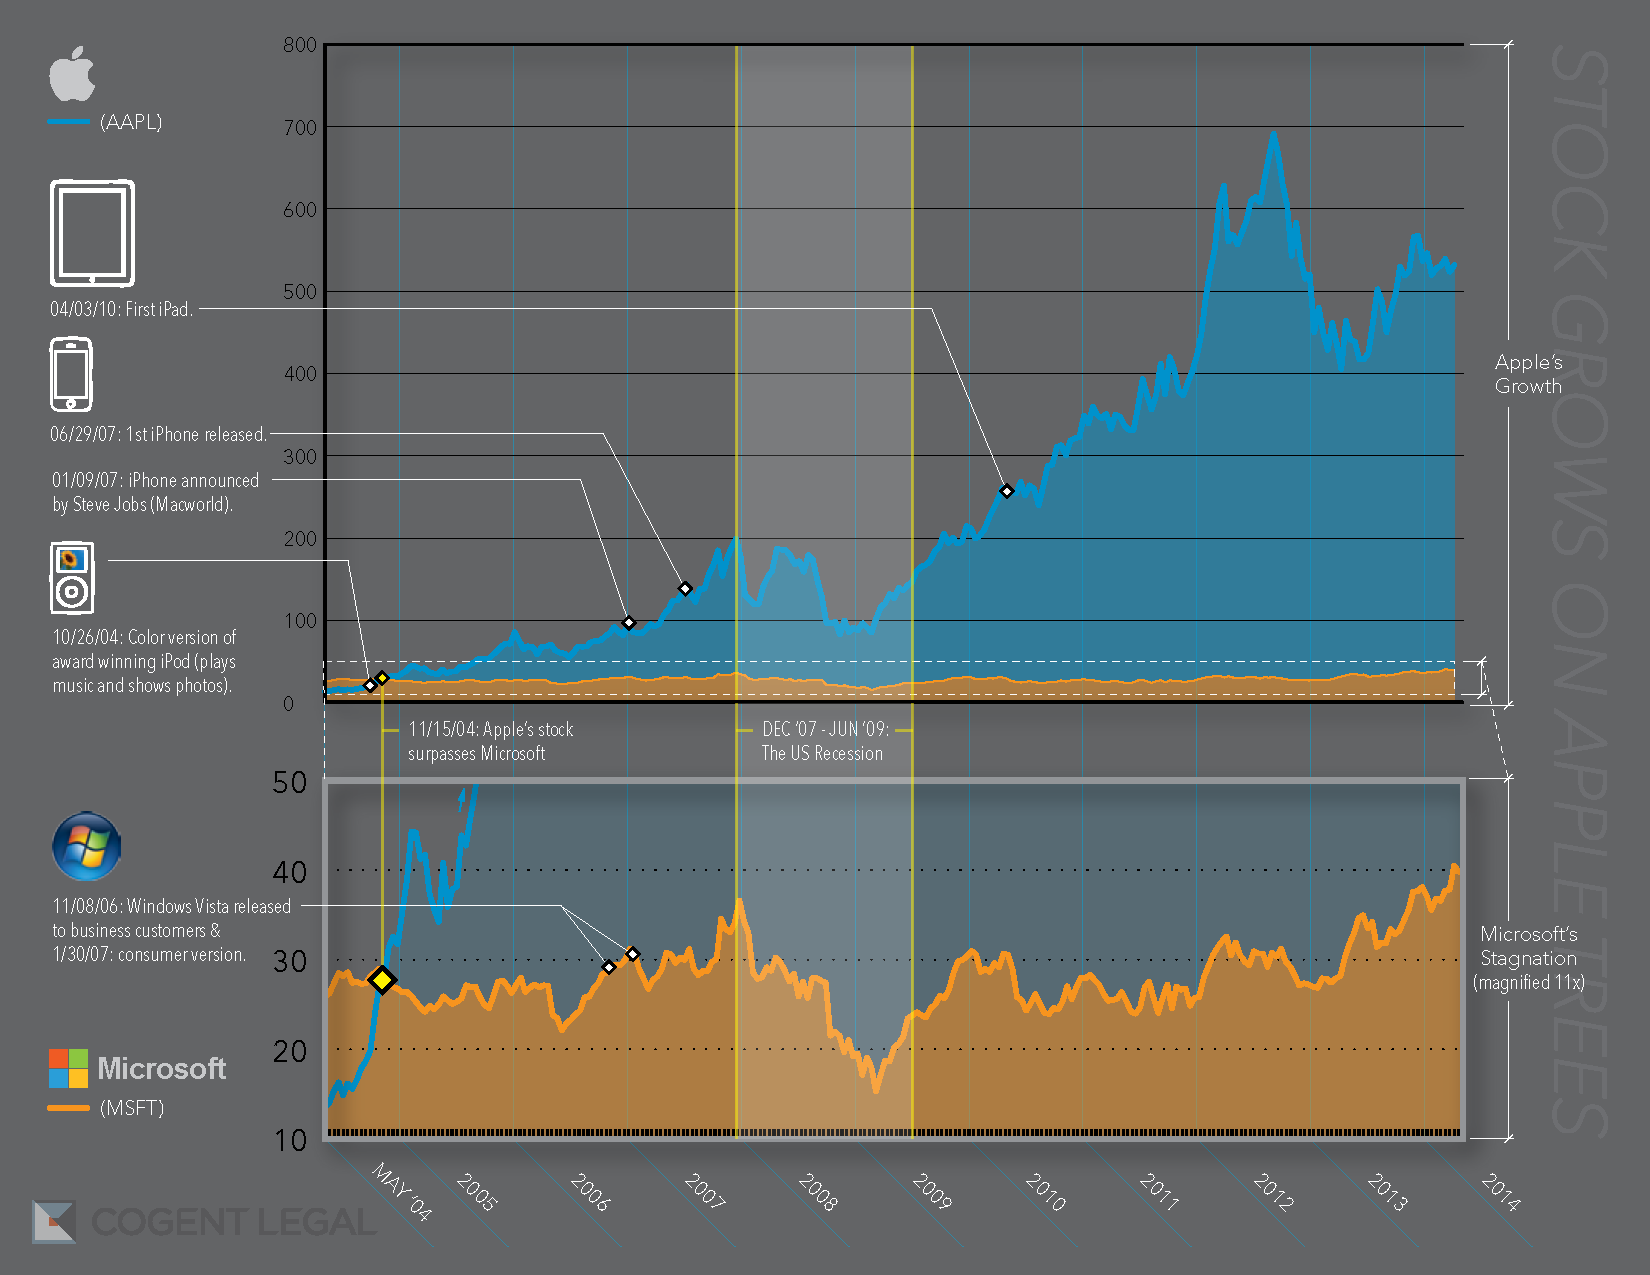
Litigators or litigants may be able to make simple graphs themselves using Excel. However, more complicated graphs benefit from expert tools like Adobe Illustrator. For example, the chart below shows a comparison of the performance of Apple and Microsoft stock over the last decade (click to enlarge for better viewing of the graph).