Menu

Morgan Smith
Go Beyond Google Maps: Powerful Ways to Illustrate Location in Your Case
 One of the most common items attorneys will put into a brief or a case presentation is an overhead map of the relevant area. Since the dawn of Google, attorneys have grown accustomed to copying and pasting the image of a Google map into a document or a PowerPoint presentation. I, too, am a big fan of using Google Maps, Google Earth, and all the street views and archival images available through them (see my earlier post on how to get the most out of using Google Maps and Google Earth for case presentation).
But don’t stop there, because so much more can be done with design tools to make a powerful visual impact if you go beyond Google. While Google Maps are easy to obtain and often enough to get the point across to a jury, they also can be confusing, cluttered, and fail to help the attorney visually communicate the main points of a case. Let’s look at some examples of standard Google Maps and alternatives created for presenting a case at mediation or trial.
Below are examples of both a Google Map and a Google Satellite View where an accident occurred:
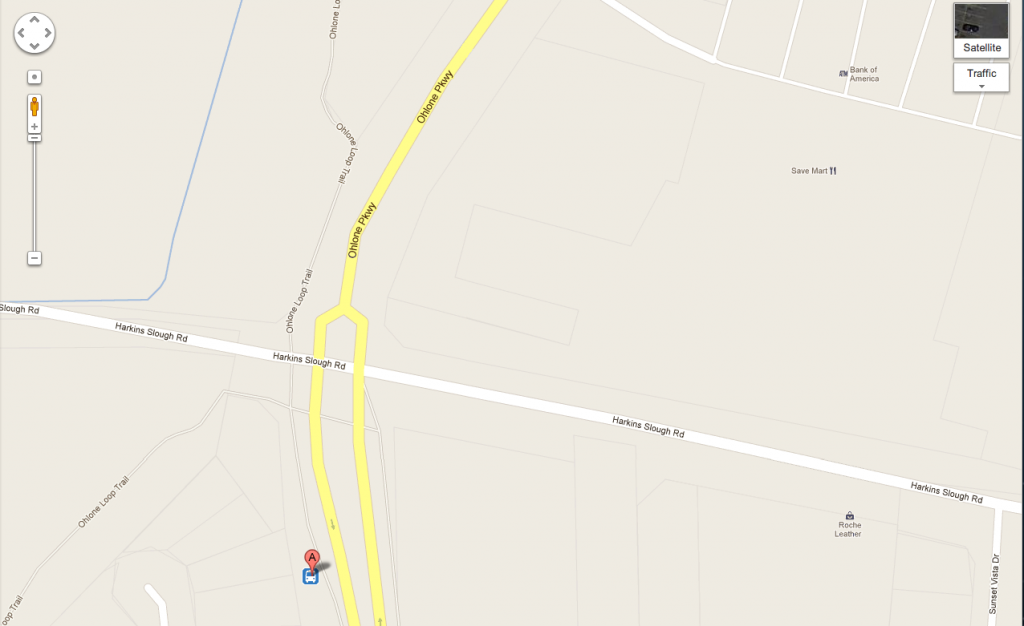
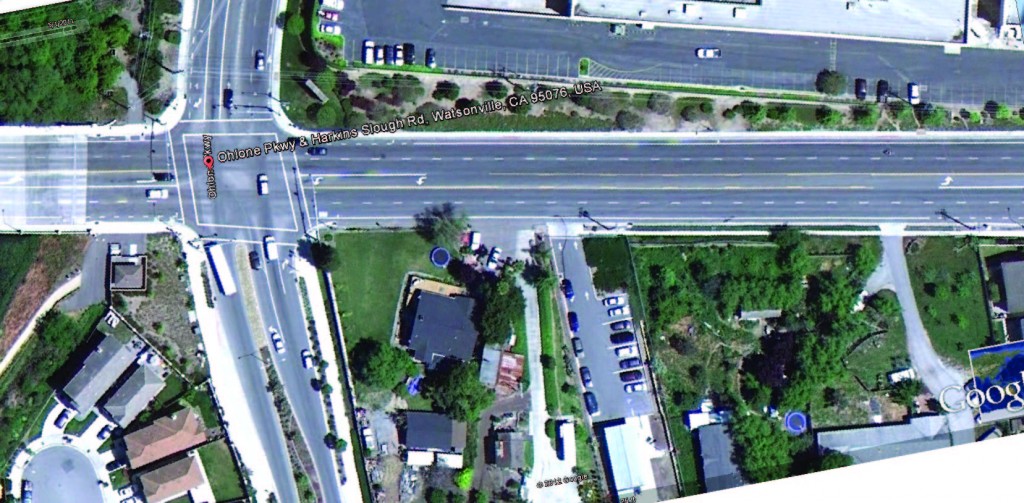
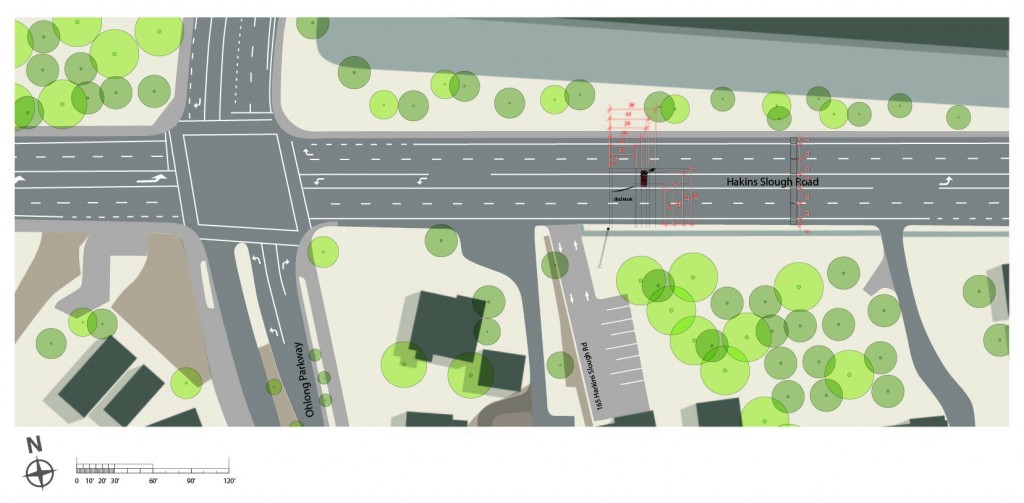
In general, Google Maps have either too much or too little information and are not specific to the case. A much more effective alternative is to create diagrams and graphics that focus on the issues of the case, rather than simply showing a location. For example, taking the photograph above, we created a to-scale diagram that laid out all the information of the police report, which can be used by experts.
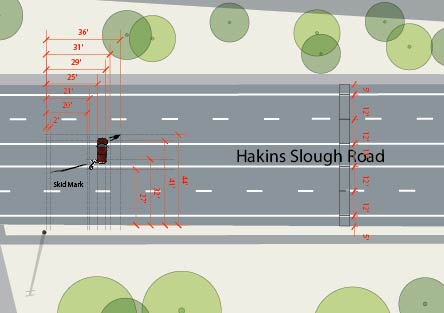
The above images reduced the detail to only that which is necessary, and included all the relevant physical data from the police reports in a manner that greatly increases the value of the image above a simple Google map or aerial photo.
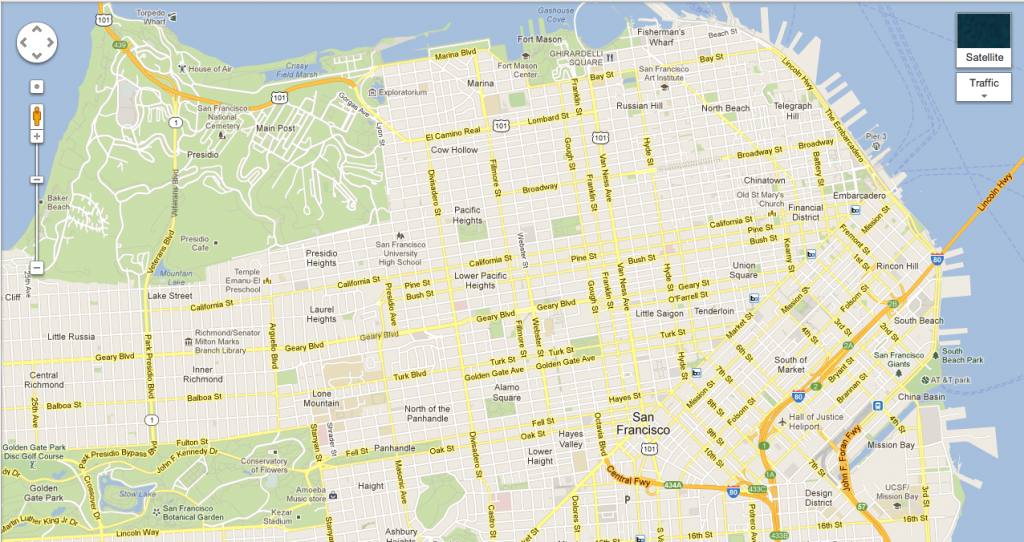
Let’s look at an example involving a much larger area of land, in this case San Francisco. Using Google Maps gives you a map that can be helpful if you’re driving, but it gets confusing with too much irrelevant data and is not specific to the litigation at hand.
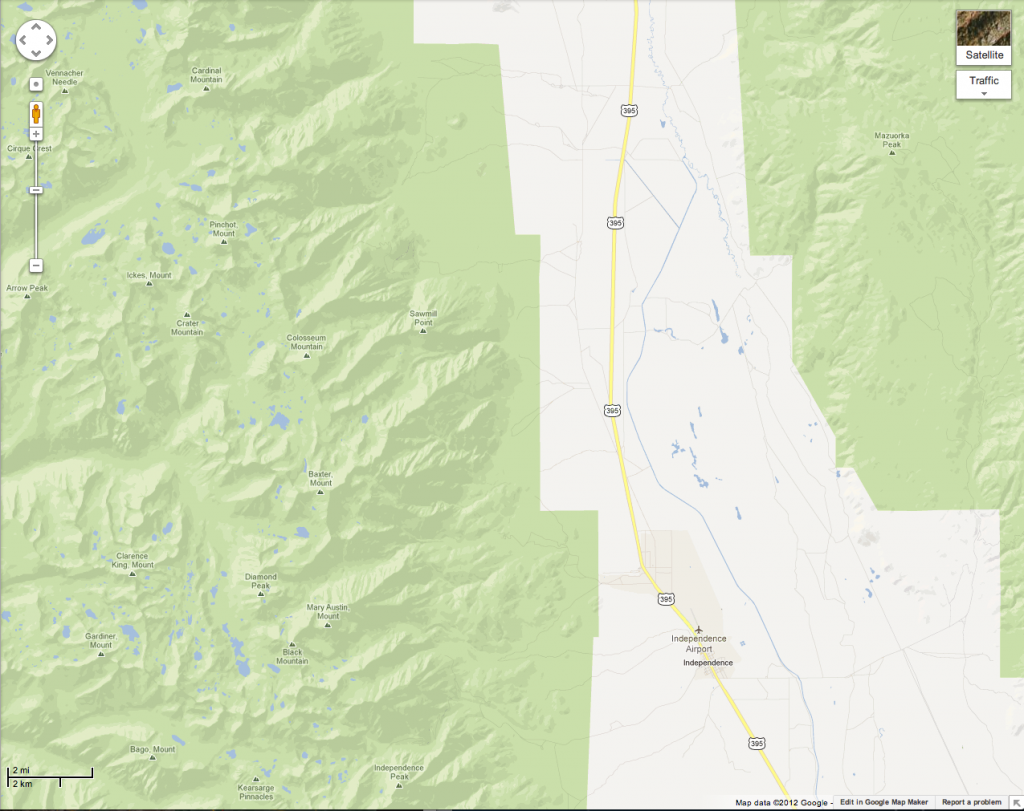
Conversely, in sparsely populated areas, you may end up with a lack of details about the location and an uninteresting image.
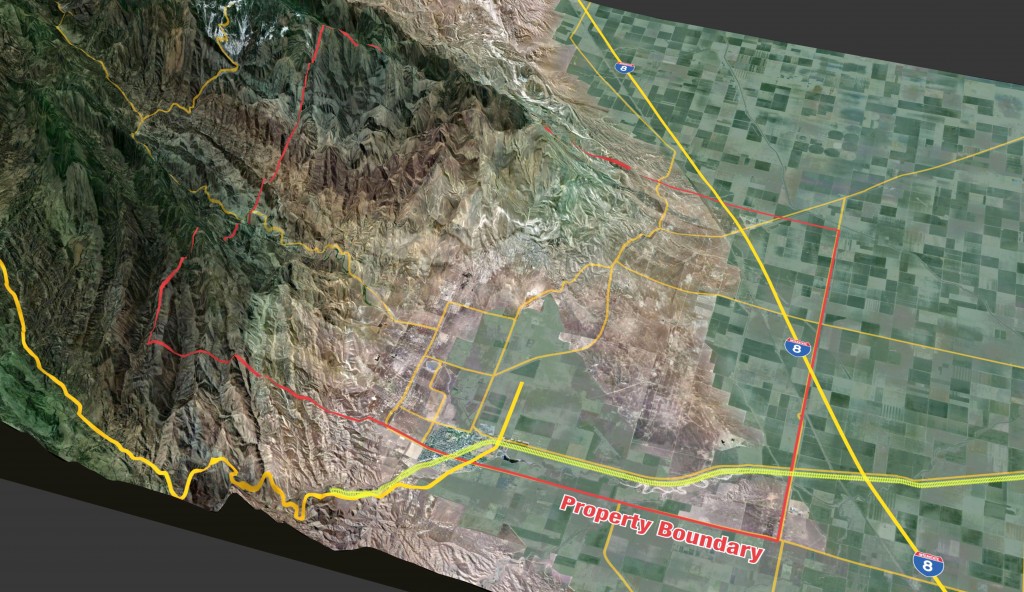
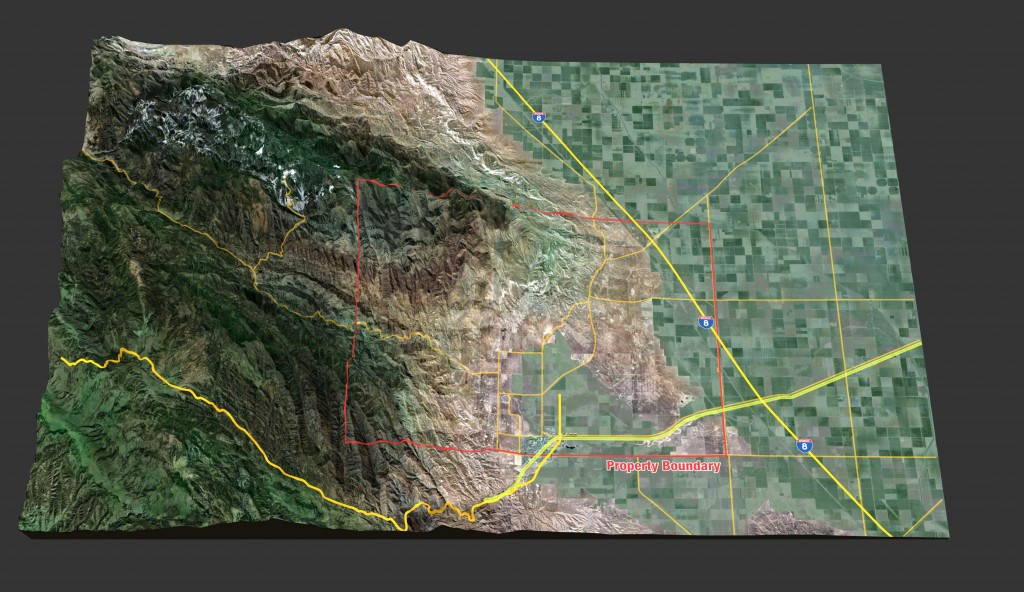
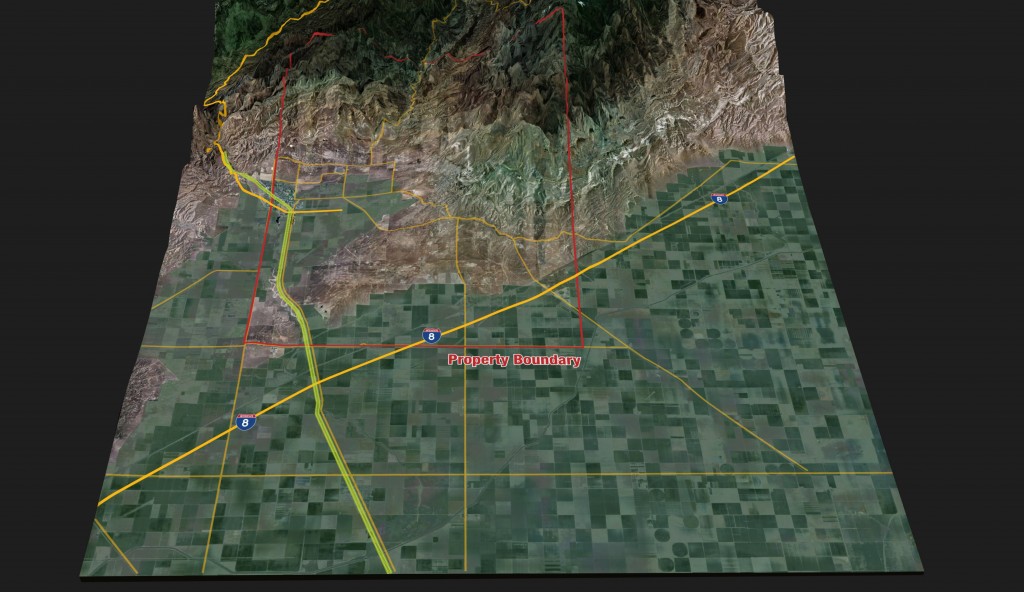
One option I strongly suggest to clients who have cases involving real estate, land issues, toxic torts or anything that involves larger areas of land is to consider developing a 3D model of the area, using available data that accurately maps terrain, streets, highways, waterways and such. By importing this data into modeling programs, we can develop accurate 3D models of any area of landmass to show whatever is at issue.
Below is a sample of such modeling that really brings an area to life in ways that satellite photos and maps simply cannot.
The above image shows a 3D model that maps the property boundary in dispute. As you can see in the series of images, the straight lines of the property are overlaid on the topography of the area to show how part of the property goes over the mountainous region. Once the area is created in a 3D model, the other great benefit is that there are limitless angles or “screenshots” of the image that can be quickly and cheaply produced to show anything the attorneys need for mediation or trial.
Since almost every case involves a location, attorneys can strengthen their case by depicting that location with a customized, state-of-the-art map or diagram that is easy to understand, engaging and relevant to the key points of the argument.
Contact us if you would like more information about options for developing charts, maps and other graphics for litigation.
If you’d like to receive updates from this blog, please click to subscribe by email.
Recent Posts
- Proper Digital Discovery, Part IV: Using Drones in Modern Litigation
- Proper Digital Discovery, Part III: Using Digital Imagery in Modern Litigation
- Proper Digital Discovery, Part II: Electronic Measuring Data
- How to Obtain Proper Digital Discovery, Part I: Photography
- California Courts – Latest Updates

