
 Good visual presentations enhance juror attention, cognition and retention in the courtroom. By providing comparisons and reference points familiar to the juror, demonstratives can help communicate difficult concepts and data. Understanding of spatial information (e.g., positions, sizes and movement) particularly benefits from graphical representation.
In today’s blog post, we’ll explore a diagram from NASA’s Apollo 11 Lunar Landing program and then discuss takeaway lessons for litigators planning trial graphics.
“That’s one small step for man, one giant leap for mankind,” said Neil Armstrong as he became the first human to walk on the earth’s moon. Neil travelled 240,000 miles to then step out onto the lunar surface and walk. But how far did he walk? Though we all saw the images of Neil’s moonwalk, viewer orientation was poor. The scope of that walk, in distance covered and range, is vague.
But thanks to the smart (and fun) spatial-comparative graphic made by John Mark Boling of the US Geological Survey Department, Neil Armstrong’s (and fellow astronaut Buzz Aldrin’s) range of moon-pedestrian traipsing can be quickly understood. Mr. Boling layered a typical baseball field, to scale, beneath a mapping of Armstrong and Aldrin’s landing site for viewer-familiar, contextual orientation. It’s an “ah-hah!” moment. We immediately understand that the astronauts’ trekking was extensive, but contained to the rough equivalency of a baseball diamond infield, with one long foray to center field and back.
The beauty of this graphic is in its conveyance of significant factors with simple immediacy of recognition, where only a moonscape would leave the viewer with no means or markers from which to understand scope and distance.
Equally so, trial and ADR demonstratives need to bring argument points and data into the realm of the familiar or easily comprehensible for the juror.
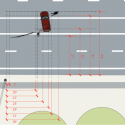
The Fourteen Seconds Before an Accident
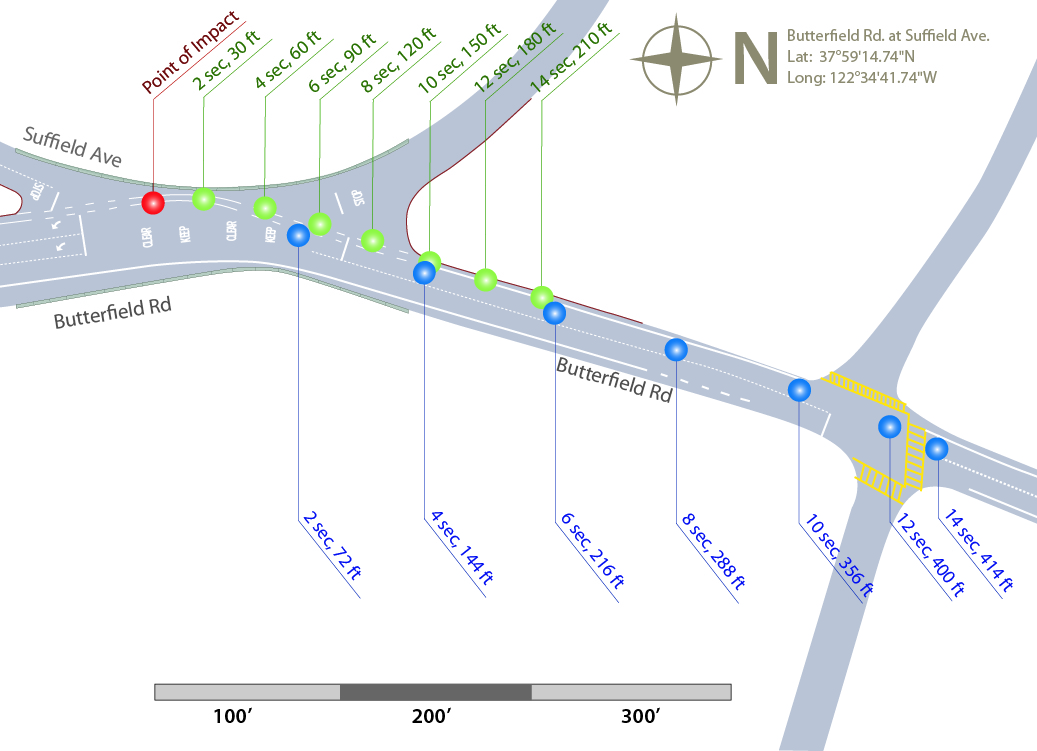
The above accident scene graphic was used by the expert and attorney to make “real” an otherwise complex algorithm of speed, distance, placement and direction for two moving autos which eventually collided. On the far left, the diagram shows a point of impact in red. To the right, the positions of the two vehicles involved are traced over the 14 second time frame before the accident. Imagine trying to orally convey this information to a jury, even with the help of a table of data. The significance of the space + time information would be lost on most jurors without this visual rendering.
Distance and Risk of Asbestos Mapped
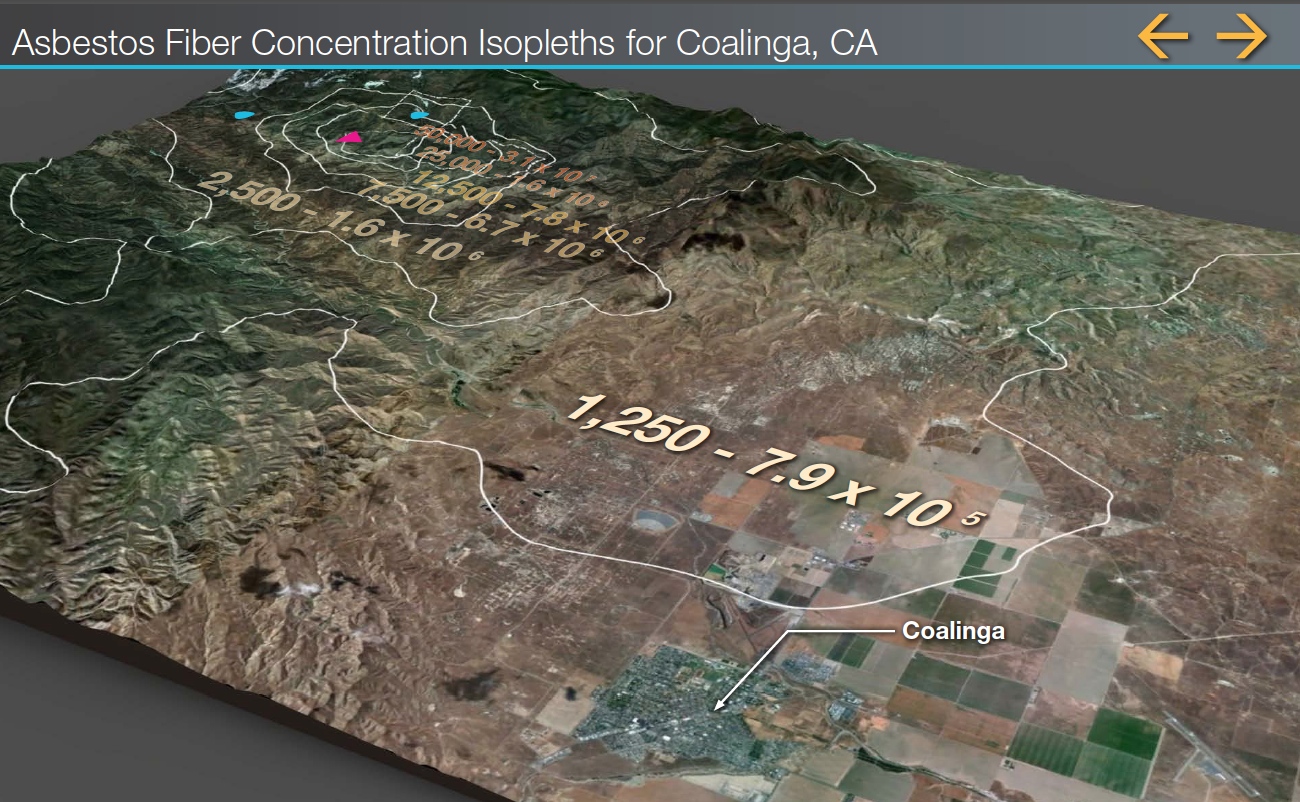
This airborne asbestos contamination/migration map was a vital expert visual aid. It gave jurors an understanding of distances and changing terrain between an asbestos mining operation and claimed points of contamination. Importantly, the map also provides exposure risk levels associated with each increase in that distance. “Risk” is mapped for the jurors in a tangible, spatial realm.
Understanding the Microscopic Realm
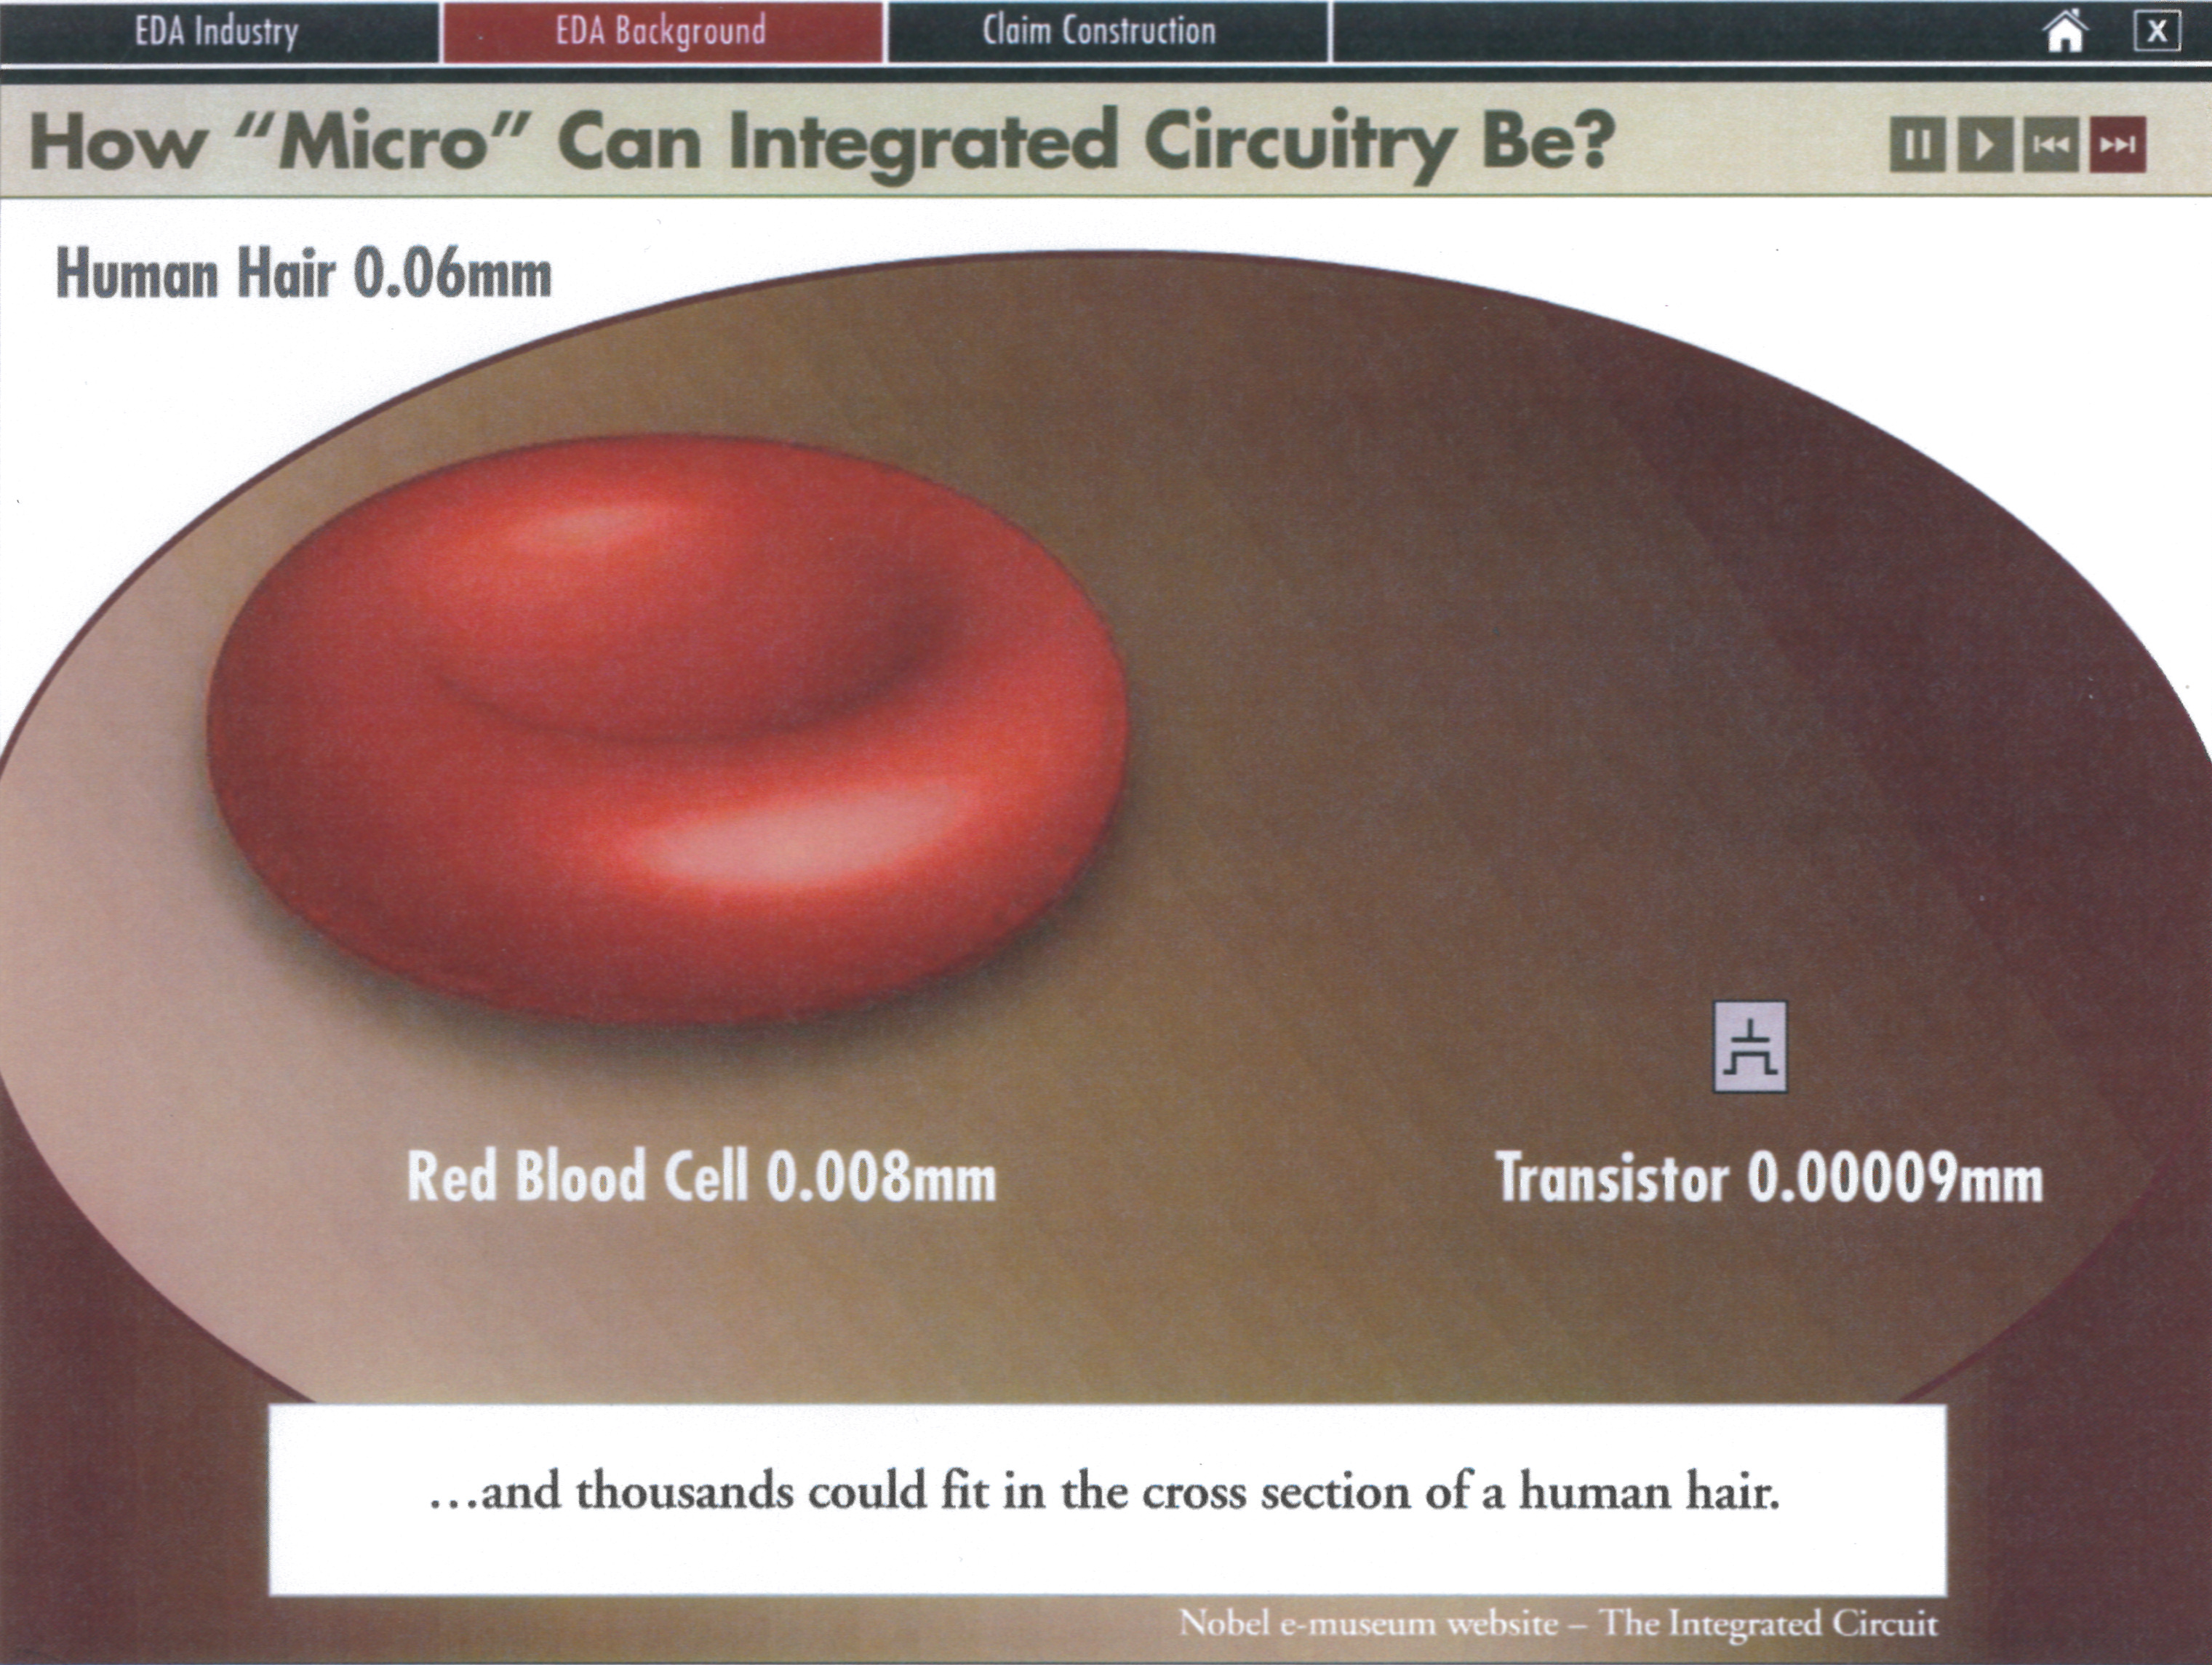
The microscopic world presents challenges to understanding too. For a past patent infringement matter, an important question that needed to be answered was, “compared to what?” Spatial comparisons help provide convincing familiar context from which the juror can better apprehend the content, relative to his or her known world, and thereby help guide the juror to contextually informed judgments.
Here, the industry was microchip development. Understanding how micro is a transistor allowed jurors to better grasp the engineering issues at hand to make informed decisions. This screen grab from our animation revealed that transistors today are a fraction of the width of a human hair or red blood cell.
Like the diagram of the baseball field under the moonwalk, these litigation examples provide visual context for scale, position and movement. We’d like to hear what you think—are these visuals effective? Do you have your own stories of spatial diagrams to share? Please let us know in the comments.
If you’d like to receive updates from this blog, please click to subscribe by email.