 This is an abridged version of an article I wrote for the September 2012 issue of the California Labor & Employment Law Review. Reprinted with permission of the State Bar of California and the California Labor & Employment Law Review.
It’s a simple fact that if you face a high likelihood your case will resolve at mediation, then you should put all you can into mediation to get the best result for your client. This includes using courtroom graphics not just in court for trial, but for mediation.
Having represented many clients in employment cases, from wage and hour to discrimination to class actions, I saw that certain issues arise in almost all employment cases and are especially well suited for graphic presentations.
This post focuses on two types of graphics particularly effective to use in mediation for employment cases: timelines and organizational charts. I’ll describe some basic tips to make them on your own, and discuss more advanced options.
Multiple studies have shown that people recall, understand and are persuaded better with a combination of an oral and visual presentation. While a mediation certainly features a different audience than a jury trial, you are still presenting information to people who will benefit from a clear, concise, visual presentation of your case in a way that no brief, no matter how well written, can do on its own.
Timelines
The number-one most effective graphic for either side of any employment case is a well-done timeline. A timeline gives structure to the case for both parties to frame their arguments around at mediation.
Typically, counsel writes out all the key dates and events in a written chronology in the brief rather than preparing a visual timeline. Often this chronology is intermixed with legal issue discussion and other items that can detract from the clear nature of what happened and when. Taking this written chronology to the next level is not difficult. What follows are steps that anyone to do on their own to make a timeline, followed by ideas that may take the assistance of a graphics specialist to prepare.
Timelines Anyone Can Make: In Microsoft Word, create a new document and use the Drawing toolbar (at View > Toolbars > Drawing, or type “drawing toolbar” in the help menu if you cannot find it). With this, you can make lines and text boxes to create the timeline. Using the Text Box tool (on the Drawing toolbar), you can create and move boxes with text wherever you like. To add color to the box, right-click on the side of the box and choose Format Text Box.
With those tools you have all you need to create a simple visual timeline of the key events of the case. This can be an exhibit to the brief that is referenced throughout the brief and gives context to the entire case.
When done nicely, a one-page timeline is important on many fronts. In the first place, it forces the attorney to condense and decide what is key in terms of events and description of those events. This process of filtering is invaluable when the attorney starts the mediation because he or she can talk about the case more clearly and better understand the key facts and the extraneous matters. Therefore, the actual act of making a graphic timeline (as opposed to typing a chronology) increases the preparation and readiness of the attorney for mediation.
Advanced Timelines: To make a more sophisticated timeline, numerous brands of professional timeline creation software are available to help import data and export timelines both for print and/or electronic display. The downside to these one-size-fits-all timeline programs is they often are difficult to customize to highlight the point you may be trying to make. (For more info, see my earlier post on creating timelines for your case.)
Alternatively, custom-designed timelines that use programs like Adobe Illustrator, Flash or InDesign to create print and/or interactive timelines are customizable for any case or persuasive argument. These custom timelines are extremely useful in the mediation setting in most any employment case. With these tools and a good design eye, the relationship of the events can be highlighted, and opposing events can be noted. Additionally, timelines can incorporate graphs that chart any number of economic, job performance, or other data that may be relevant to the events being shown on the timeline.

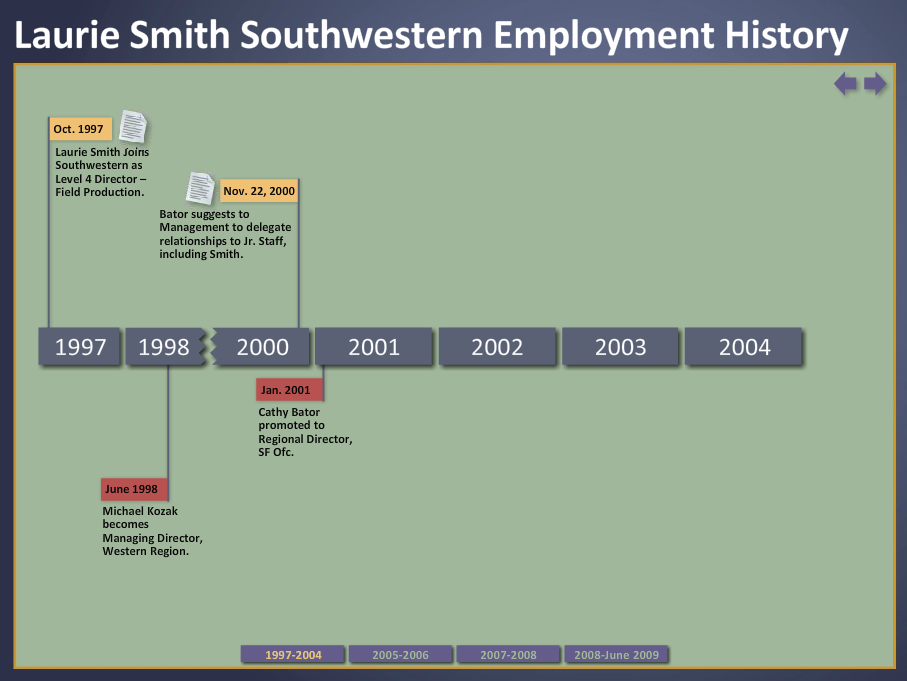
One final timeline to consider developing—which is my favorite, because of its virtually limitless possibilities for displaying information—is the interactive format (typically created with Adobe Flash). With an interactive document, you can have each event on the timeline appear with the click of a button, so the viewer is given no more information than is needed step by step. In other words, the attorney builds an argument by presenting information on the timeline sequentially, rather than showing everything all at once.
With interactive timelines, you also can add icons so that any document, chart, photograph or video can be included in the timeline, then enlarged and viewed with the click of a button. For example, in an employment harassment/discrimination/wrongful termination case, the timeline could start with the date of employment, with an icon to open and view the employment contract. The next entry could be the signed employee handbook, with an icon to highlight the anti-discriminatory policy of the company. The next entry could highlight the claims of discrimination, including video testimony of the witnesses, photographs of the harassing items from discovery. Following entries could include the termination process and end with the ability to view the entire economic loss analysis of the experts.
Attorneys find that if such a timeline is prepared for mediation, then they have their entire opening statement ready to go if the case does not settle. It also shows opposing counsel that the case is prepared for trial if necessary, which generally makes it much less likely that the case will actually be tried. (For additional timeline examples, please see this section of our firm’s portfolio.)
Organizational Charts
All too often, an employment case can end up being like a play where endless bit characters appear and leave the stage and you forget who is who. While briefs generally do a good job of at least identifying all the important and bit players of the case, the relationship among them does not translate well in written text alone.
Many employment-related cases benefit from an “org chart” with all the players shown in the chart, whether they are part of the same company or not. Org charts are a good example of how you can have identical and undisputed facts on the relationship of the parties, but depending on whether it is a plaintiff or a defendant preparing the chart, they might look extremely different in presentation. There is a great deal of room for persuasion by how close or far you design the relationships, and who is on top (the position of power) and who is on bottom. This subtle, and sometimes not-too-subtle, method can really help shape the first opinion that anyone has about the case, just by looking at the graphic.
Org Charts Anyone Can Create: For this type of graphic, you can use Microsoft Word (as explained above for creating simple timelines) to create boxes and arrows for an org chart. Enlarging and displaying it on a 3 x 4-foot blow-up board, nicely designed to highlight the points of the party, is also effective and appropriate for mediation.
Advanced Org Charts: An interactive electronic org chart can incorporate any level of additional documents, charts and graphs, and allow a multitude of relationships to be shown on a complex case. Different branches of a defendant’s business will have their own hierarchies, and sometimes being able to control the level of information seen at any one time helps prevent information overload to the viewer.
Any form of an org chart is better than none and should be considered for most any employment case mediation.
Finally, since wage and hour cases and class actions often center on an extremely large amount of precise data, I encourage you to check out my earlier post, “Three Tips for Attorneys to Present Economic Data (And Not Be Boring).” Taking the raw data and synthesizing, filtering and visually presenting it is generally a much more effective way to make your case.
Please contact me if you’d like to discuss ways to use litigation graphics to present your employment case at mediation.

