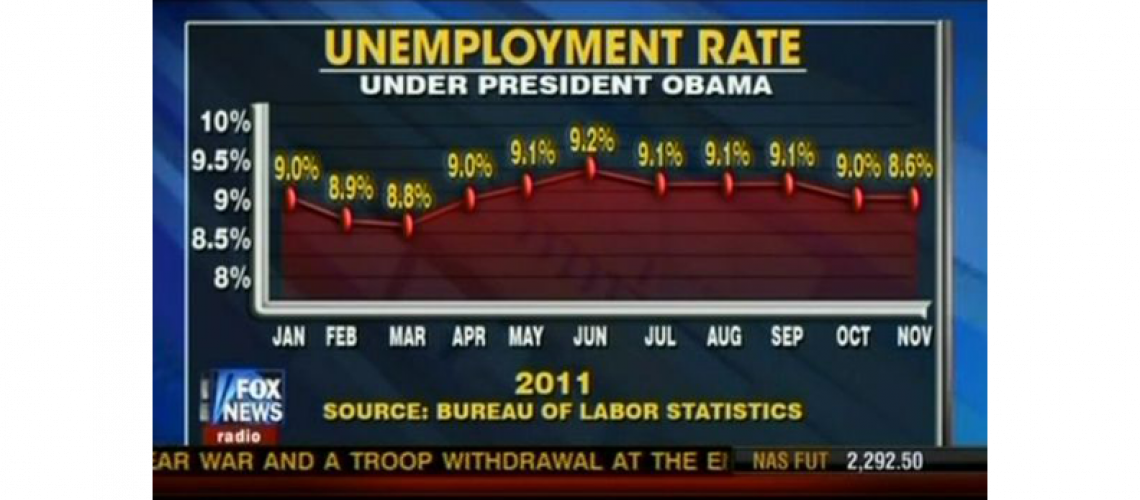
 Looking through the Yahoo news feed yesterday, I came upon an article about a misleading graph used by a major news organization. With a little bit of additional research, I found many additional examples of news graphs and charts that are intentionally misleading, and I realized this is something that’s worth bringing to the attention of trial attorneys. If you are an attorney who deals with graphs and charts presented by opposing counsel, then understanding the basic ways in which these graphics can mislead is the foundation of being able to properly object and have them thrown out.
Additionally, these examples taken from the news can help you determine when one side’s advocacy verges on misleading a jury. Some commentators believe that attorneys have an ethical obligation not to use “truthiness” in visuals that unfairly advocate one point of view (see this article for a discussion, The Truthiness of Visual Evidence). I look at the issue from a more practical standpoint within the framework of the advocacy system: that is, the big risk for any attorneys who use misleading visuals is a potential loss of credibility from the jury when opposing counsel calls them out on the misleading nature of the graph.
Let’s take a look at some samples and discuss what makes them misleading, so that in litigation you can be better prepared to flag an unfair or misleading visual. Keep in mind how a jury might respond if the misleading nature of the graph were pointed out to the jury by opposing counsel. (more…)


