
 Great graphics make difficult concepts understandable, and such graphics are what we aspire to each day at Cogent Legal. Today’s blog entry will dissect a graphic from the New York Times and think about what makes it work.
The October 8, 2013, edition of the New York Times included a great graphic in its report on the award of the Nobel Prize in physics for the prediction of the Higgs Boson. The interactive graphic entitled “What is the Higgs?” tackles the difficult task of explaining a particle so fundamental that it has been called the “God Particle.”
The Higgs graphic exemplifies four tools for litigators: analogy, illustration, animation and simplicity. Below, I’ll discuss each of these tools briefly and conclude with some litigation examples.
Analogize
Our brains categorize and compare things to understand them. For example, automobiles were once compared to horseless carriages. As another example, the animations below compare internet data flow and bandwidth to the water flow in a pipeline.
Illustrate
Visual input helps our brains process and retain concepts. As set out in a Department of Labor study on effective presentations, combining oral and visual information increases audience retention significantly. 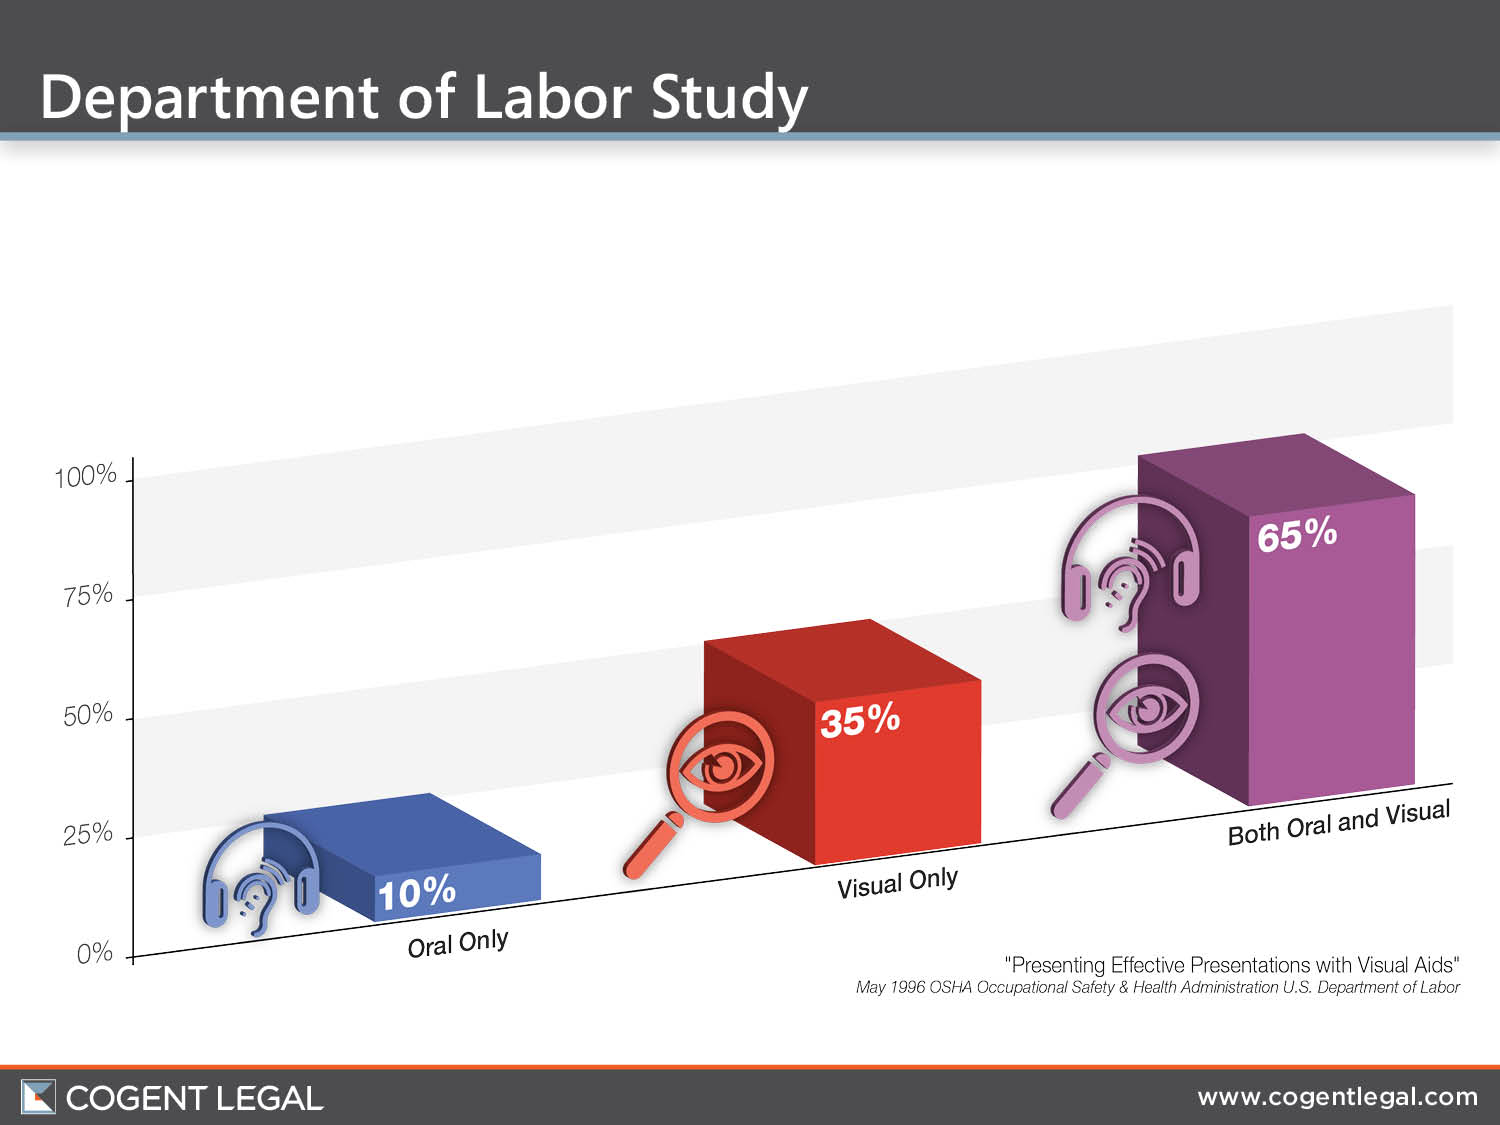
Animate
Animating your illustrations can help explain change or the passage of time, and movement grabs and holds audience attention.
Simplify
Once you have your analogies and an idea of how to illustrate/animate, consider how simple you can be. Simple graphics can save money and time, and more importantly, they may avoid extraneous distracting details. On the other hand, judges and juries see sophisticated graphics every day on television, and graphics that are too simple may be dismissed as “cartoonish.” We balance these considerations daily in planning and executing graphics.
Samples
Below are a couple of samples that exemplify these principles along with short captions.
Sample—the Internet Pipe
This animation analogizes bandwidth (the rate of data flow on an internet connection) to water flow in pipes. To illustrate the completion of a download, the animation uses the analogy of a bathtub filling up. The animation also illustrates the passage of time with a clock graphic that advances.
Sample—the Mixing Process
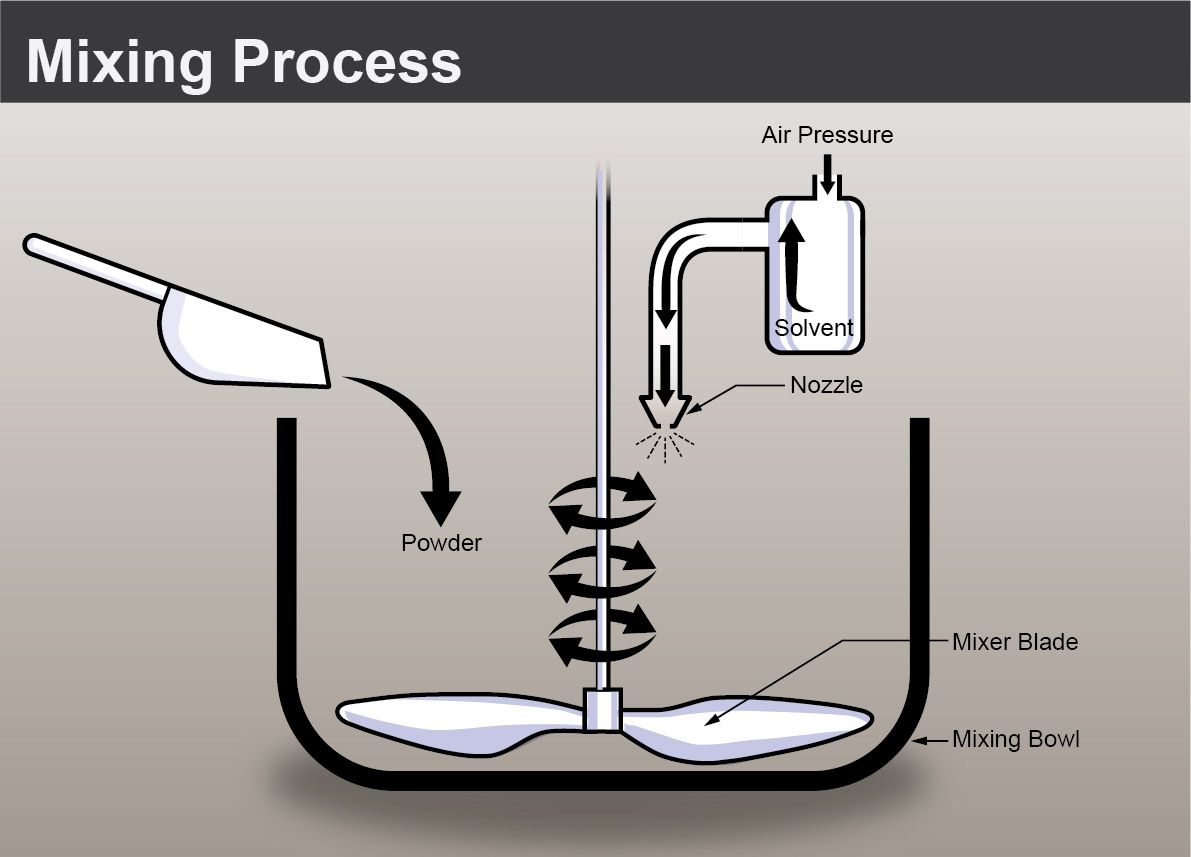 We used a simple drawing like this to help in the examination of a witness as to a mixing process. We made the original drawing in just a couple of hours based upon the witness’s hand-drawn sketch, keeping the simplicity but greatly improving the clarity and readability of the concepts.
What do you think of the Higgs graphic? Did it help you understand the Higgs Boson? What about the internet pipe and mixing process samples? Let us know in the comments.
If you’d like to receive updates from this blog, please click to subscribe by email.