 I have always loved the challenge of figuring out a way to show a large set of information all in one graphic. The undisputed master of high information graphics is Edward Tufte, whom I had the privilege of seeing recently at his latest swing through the Bay Area. Mr. Tufte has made the point for years that you can trust the viewer of any graphic to decipher huge amounts of information, IF (and only if) you take care in the way it is presented so the viewer can find meaning in the data. I take his message to heart, especially when determining ways to show a great deal of data in a single graphic.
This post spotlights three informational graphics that Cogent Legal created and describes how we wrestled with a mountain of data to present a large amount of information in a way that is instantaneously understandable and visually appealing to anyone looking at the document. While these three samples are 2D blowups for display, they certainly can be made digitally with interactive functionality for display electronically as well.
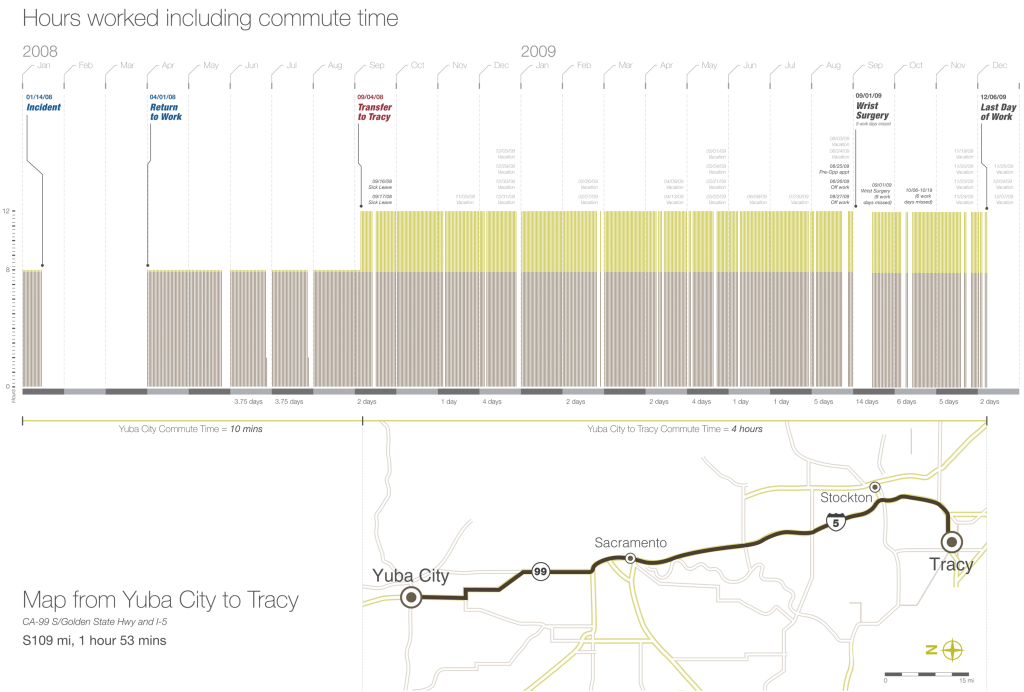
In a recent case, I got the opportunity to let my inner Edward Tufte shine with the development of a graphic on a case where a person was injured in an accident. Our job was to show the overall working pattern of the plaintiff, including the greatly increased commute time following the incident and the days off that he took. The information we had to work with was as follows:
1. The plaintiff missed a few months of work after the incident.
2. The plaintiff returned to work, worked for about five months, and was transferred to a city with a two-hour commute each direction.
3. The plaintiff worked for over a year in this longer commute situation before leaving his job.
4. The plaintiff missed more than a normal amount of work during this whole period of time.
When deciding how to present all this information, I wondered if we could use bars for every day of the week that he worked, and have bars absent for those days he missed to visually show the entire work period after his injury. The following is the graphic that we developed (click to enlarge):
The viewer can see all the time that was worked versus all the time that was taken off from work, with a visual color change to show the increased commute time to the new job. While we included a great deal of the factual information as to specific days off, we decided to make those notes small and less noticeable so as to not detract from the overall visual of the graphic. If a witness or attorney needs to refer to the specific information, it is included, but not prominent. Also, the map on the bottom provides a visual for the distance of the compute that is being described by the data above.
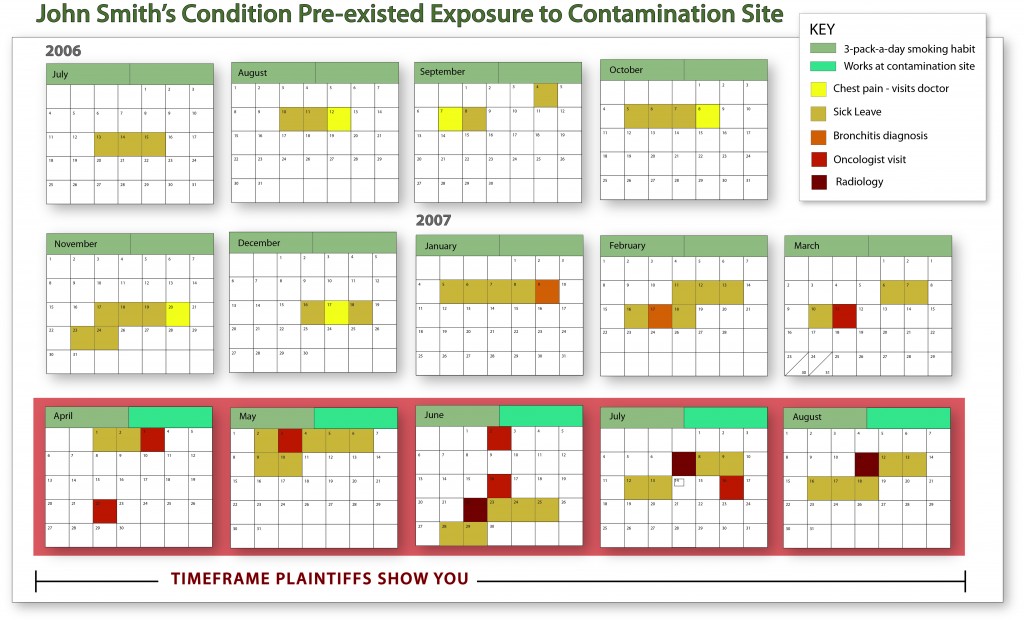
This next example also shows a lot of information that makes sense in a single view of the graphic. In this case, we used color coding of a calendar for events to show a year at a time of information that is placed in context. We developed the graphic below to show that treatment of the plaintiff pre-dated the incident by quite a period of time, and was fairly substantial as well.
The benefit of placing all of this information into a single graphic is that is allows the full picture of the story to be told with one look. Imagine trying to prove this point without any visual help by having either the plaintiff or an expert testify as to all the appointments that occurred before and after the incident. While you can certainly do it, you might well lose the interest of the listener after the third or fourth question. A well-done visual is instantly understandable while conveying a great deal of information.
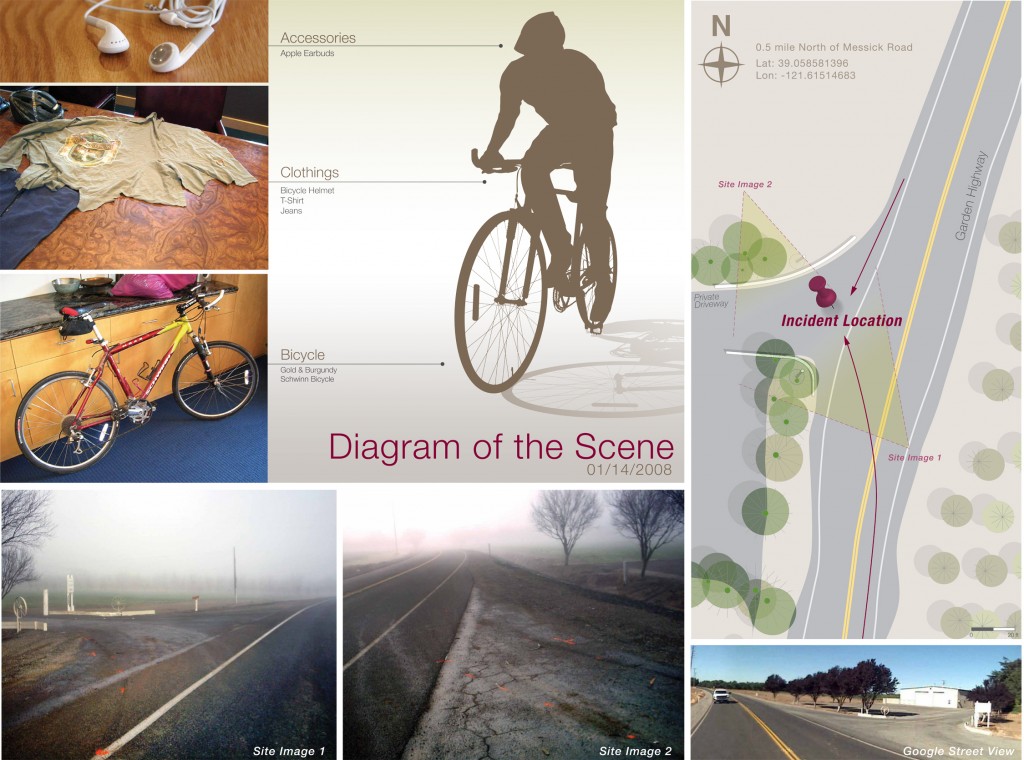
When Cogent is hired to do the graphics on a case, one final thing we like to do for clients is put all the key graphical elements onto one visual hard board blow-up that can be used and seen by a jury though the whole trial. While not necessary a data-heavy graphic like those shown above, the summary board is extremely powerful to present the basics of any case, and often includes many elements to make the point. An example arising out of a bicycle injury case of a summary of evidence board is show below.
I firmly believe that every case deserves some key graphic blow-up board that summarizes the issues and data into a concise visual for the jury. The act of having to think about and create the tight visual helps the overall presentation of a case for any audience, whether a jury, mediator or opposing counsel.

