

 Looking through the Yahoo news feed yesterday, I came upon an article about a misleading graph used by a major news organization. With a little bit of additional research, I found many additional examples of news graphs and charts that are intentionally misleading, and I realized this is something that’s worth bringing to the attention of trial attorneys. If you are an attorney who deals with graphs and charts presented by opposing counsel, then understanding the basic ways in which these graphics can mislead is the foundation of being able to properly object and have them thrown out.
Additionally, these examples taken from the news can help you determine when one side’s advocacy verges on misleading a jury. Some commentators believe that attorneys have an ethical obligation not to use “truthiness” in visuals that unfairly advocate one point of view (see this article for a discussion, The Truthiness of Visual Evidence). I look at the issue from a more practical standpoint within the framework of the advocacy system: that is, the big risk for any attorneys who use misleading visuals is a potential loss of credibility from the jury when opposing counsel calls them out on the misleading nature of the graph.
Let’s take a look at some samples and discuss what makes them misleading, so that in litigation you can be better prepared to flag an unfair or misleading visual. Keep in mind how a jury might respond if the misleading nature of the graph were pointed out to the jury by opposing counsel.
Truncating Graphs
Wikipedia has a nice summary of the various basic ways you can mislead with graphs when presenting data. The primary (and in my experience, the most common) misleading tactic is to exploit the scale of a graph to try and make your argument visually when the data alone does not make a compelling argument. In other words, the graph makes the data look better or worse than the numbers actually are.
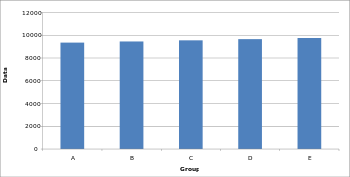
Here is the Wikipedia sample of a graph with proper scaling from 0 to 12,000. Visually you see the small changes between each value over time:
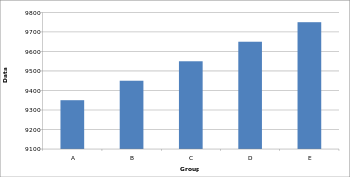
Now here is the sample where the y axis (the vertical one) starts on 9100 and goes to 9800, which exaggerates the change since it looks like the final value is more than twice as large as the initial value, when it is actually only about a 4% increase.
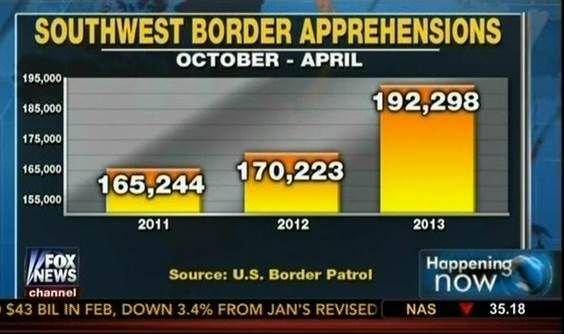
So now that we know the tactic, let’s look at some samples. The first one is the one mentioned yesterday on the Yahoo news feed:
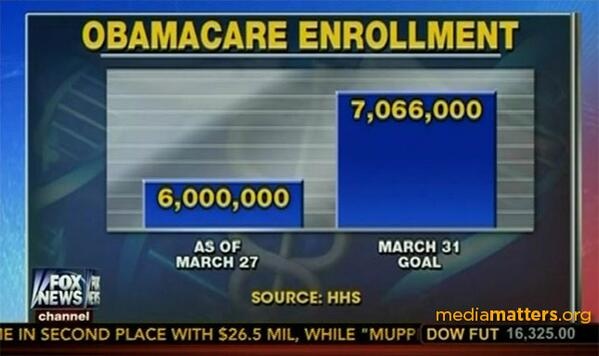
As you can see from the image, while the numbers may be accurate, it appears as if 7 million is 3 times the size as 6 million. The point of the graph is to make an argument that sign-ups are far below the goal, and removing the proper scale emphasizes that point.
The chart below uses the same tactic to make a larger amount appear about four times greater than the smaller amount when the actual difference is only 7%.
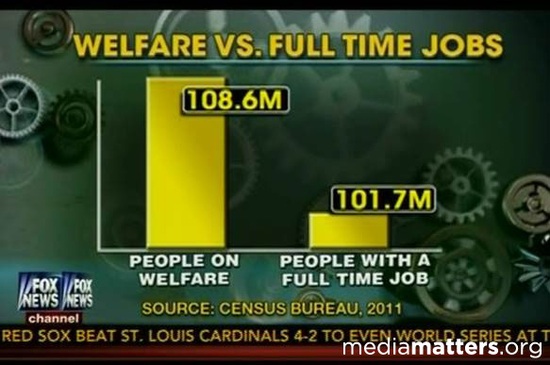
Or a 16% difference look about three times larger than the smaller amount:
When it comes to manipulating scale, Fox News is not the only place where I found examples of altering the Y-axis to emphasize a point. Here is a graph from Rachel Maddow’s MSNBC show:

From this chart it would appear as if the deficit was likely to go into a surplus the following year if the trend continued. That is, of course, unless you look at the fact it starts at 500 billion. However, I do at least give credit for both of the last two charts for having a scale and noting that it starts at something other than zero.
From a legal perspective, my view is you would be unwise to bring any graph like this into court, since you risk losing credibility with the jury. But if you do have to modify the scale, at least honestly mark the scale and point out to the jury you have done so, as the last two samples do.
Omitting Data
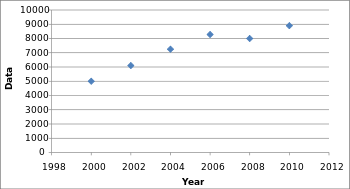
Another typical tactic of misleading graphs involves omitting data to create a trend line that does not really exist. Look at this first graph below, which is accurate and includes data from each year:
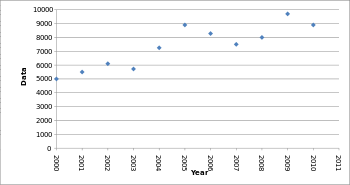
By removing half the data points, you can make it look like a steady march upward:
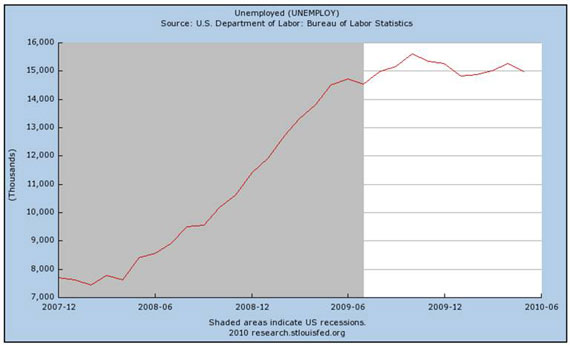
Now let’s see how that’s used in the real word:
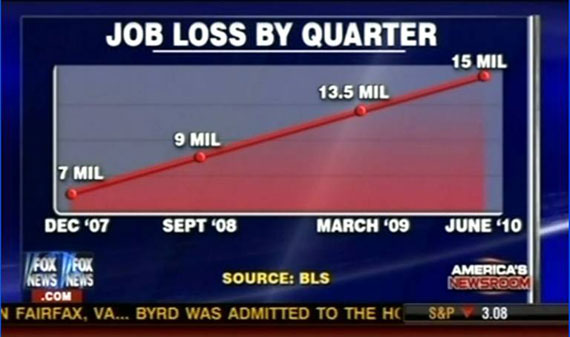
That graph has a number of wonderfully misleading things going on. First, notice that the dates on the horizontal axis are apart in uneven increments: nine months (Dec. ’07 – Sept. ’08), six months (Sept. ’08 – March ’09), and one year and three months (March ’09 – June ’10)—yet the even spacing between them suggest they are the same amounts of time. Widening the space for the six-month period flattens out a spike from September ’08 to March ’09. Secondly, notice that the amounts jump by 2 million, then 4.5 million, then by 1.5 million, but the placement of the points on the line makes it look like unvarying increases. If this data were represented on a graph without those tricks, it would resemble something closer to this one from the Bureau of Labor Statistics:
Just Plain Plotting Wrong
Of course, one of the simplest ways to mislead is to plot the graph wrong to help prove your point.
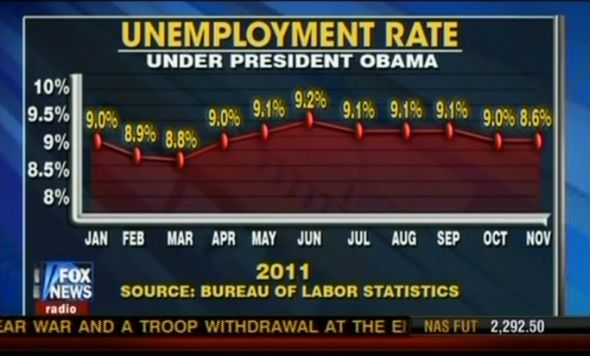
I may not be very good at math, but I’m pretty sure that 8.6 is below 8.8, yet it doesn’t look that way on the line above.
Call for Examples
If anyone has any good examples of misleading graphics (especially if they are from actual litigation), I would greatly appreciate you sharing them with me and I’ll post some of the best examples. You can comment in the comments below, or email me.
To receive updates from this blog, please click to subscribe by email.